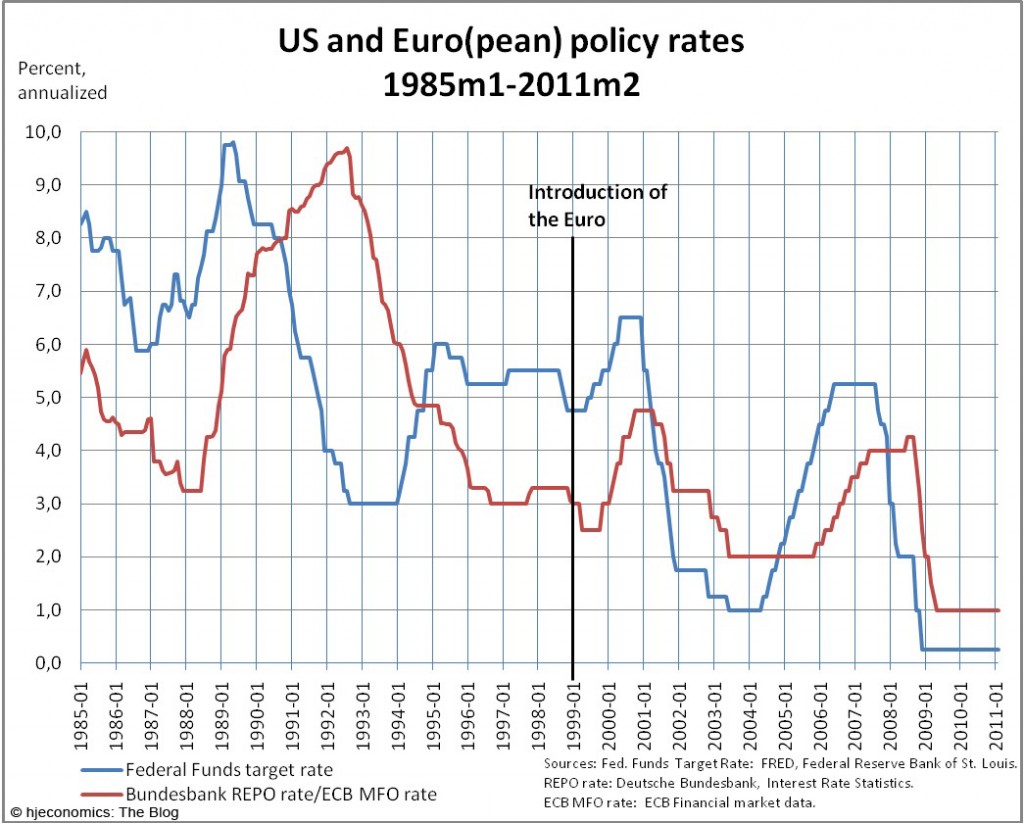
Some days ago, I wrote about an interesting post by Gavin Davies on his Financial Times blog, where he argued that European monetary policy, through the actions of the German Bundesbank and now the European Central Bank, follows the US Federal Reserve’s interest rate decisions with some delay. An observation leading him to label the FED and ECB “strange bedfellows”. The data behind the argument is seen in the following figure:
The Federal Reserve’s policy intentions are throughout the period measured by the target value for the Federal Funds Rate (formally, this time series is discontinued as of December 2008, and I show the upper value of the 0-0.25% target range of the Fed for subsequent periods). European monetary policy is measured by the Bundesbank’s Repo rate up until the end of 1998. From 1999 and onwards, the rate for main refinancing operations set by the European Central Bank is used. Indeed, by eyeballing the figure, it appears that Europe is following the US. My own eyeballing led me to conjecture that much of the thrust behind the argument came from the events in the early 1990s where the Fed’s rate cuts in 1990-93 were followed by the German cuts in 1992-95. Hence, the ECB may not be much of a follower.
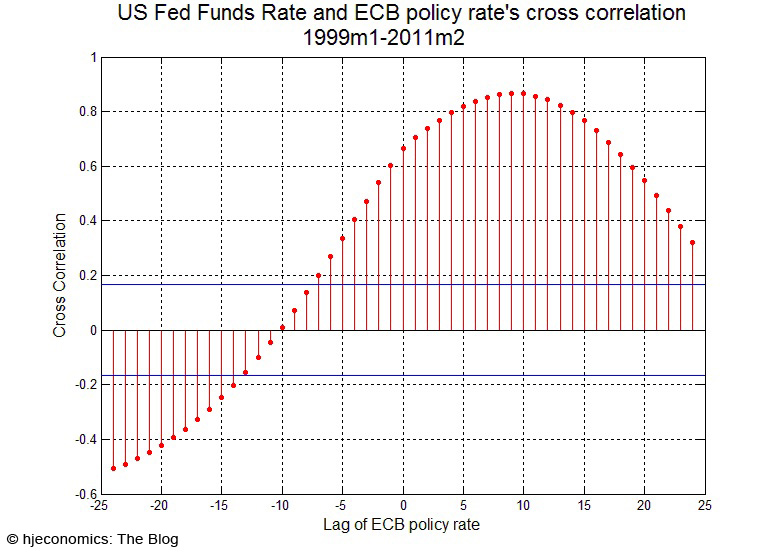
Well, eyeballing is never a good idea when it comes to data. We have statistical methods for making inference, and my eyeballing was indeed way off. I have measured the cross correlation for the policy rates for the entire sample, as well as for the subsample involving the existence of the European Monetary Union.
From these cross correlations one sees that the highest correlation actually arises in the ECB-only subsample. Indeed, as Gavin Davies reported, at lag 10 the correlation coefficient is over 0.8; a value not reached over the entire sample. In either sample, however, the Fed’s actions are indeed leading the ECB’s. However, these cross correlation functions also reveal a highly disturbing feature.
Cross correlation functions displaying the oscillatory patterns seen in these figures are known to occur when data are highly persistent and trended. And in fact, both policy-rate series are highly persistent and both are trending downwards. These properties lead to the well-known phenomenon of spurious correlation. One cannot reject that the series have a unit root, but leaving that controversial issue aside, it has been known for long time that series with ARMA (Auto Regressive Moving Average) properties may exhibit significant and oscillatory cross correlation functions even though the series are statistically independent. I.e., the measured correlation is spurious. An early “pre-unit-root literature” reference is Awe, O., 1964, Errors in correlation between time series, Journal of Atmospheric and Terrestrial Physics 26, 1239-1255.
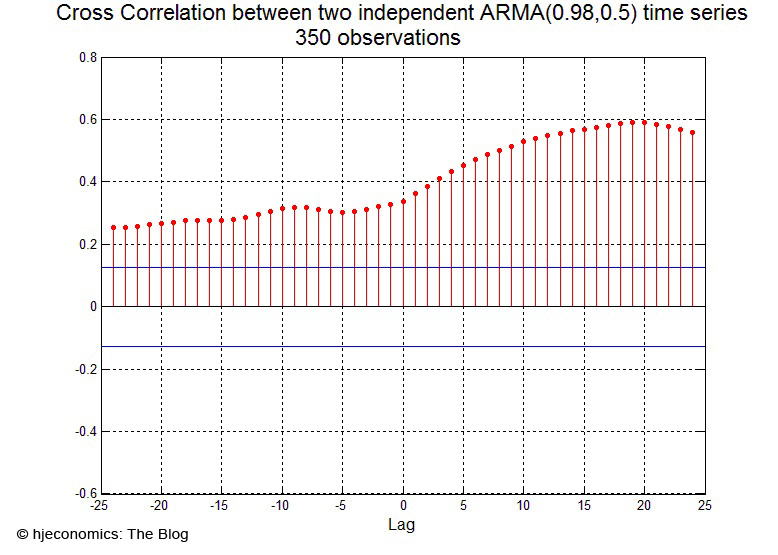
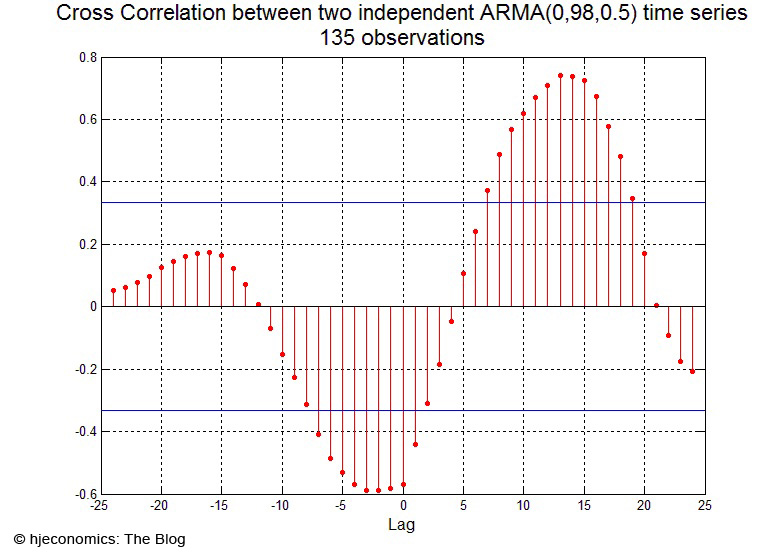
As means of illustration, I show figures for the cross correlation functions between two statistically independent ARMA processes for a long and shorter sample (mimicking the Fed/Europe and FED/ECB sample lengths, respectively):
As evident, even though the time series have no relation whatsoever by construction, their persistence accounts for a spurious cross correlations quite similar to the one found in the monetary policy data.
So, my eyeballing was not on the spot. A formal statistical examination, however, reveals that there is not basis for placing the Fed and the ECB in the same bed. At least not from looking at simple cross correlations extracted from the raw data.


