January this year, John Taylor posted a scatterplot on his blog. He plotted quarterly US unemployment against fixed investment as a fraction of GDP for 1990q1-2010q3, and found a very strong negative correlation (jpg ). In contrast, the relationship between government spending and unemployment tended to be positive, albeit not so strong. On the latter finding he notes that “the correlation is not due to any reverse causation from high unemployment to more government purchases”. Overall, he therefore concludes that “Encouraging the creation and expansion of businesses should be the focus on government efforts to reduce unemployment” and further:
“The recent compromise agreement to prevent the increase in tax rates on small businesses and the move to lighten up on the anti-business sentiment coming out of Washington are two steps in the right direction.”
I.e., he reads a causal interpretation into the plot (probably backed by some of the on-going research he mentions in the blog post).
When Greg Mankiw this Tuesday posted the graph on his blog under the heading “A Striking Scatterplot”, the finding got wide attention on the web. Mankiw, the usual admirable cautious academic, remarks that such a plot says nothing about causality, and any interpretation is therefore debatable. I agree wholeheartedly, and also find the correlation impressive. Paul Krugman, on the other hand, has no problems shooting down Taylor’s causal interpretation and adopting the opposite interpretation. He breaks down investment into non-residential and residential components, and argues that it is the recent bust in housing that drives the correlation: Since the housing bust has caused a consumption decline and higher unemployment, all investment is cut back. Any remaining talk is “just politically motivated mythology”. John Taylor responds calmly that the strong correlation is present over the entire period in particular for non-residential investment – a fact, not mythology.
Justin Wolfers then argues that the correlation breaks down if the sample is extended back in time, and labels the Taylor plot an example of “Advocacy Science”. Not surprisingly, Taylor disagrees and presents his case for a longer sample, back to 1960, here. He argues that Wolfers fails to acknowledge that the structural rate of unemployment since 1948 has undergone many but slow changes, which would cause shifts in the scatterplot. I guess this is much akin to the insight that short-term Phillips curves are present in scatterplots even though they over long samples may appear absent because of low-frequency movements in the natural rate (Wolfers can probably still quarrel about the missing period 1948-60 in Taylor’s rebuttal).
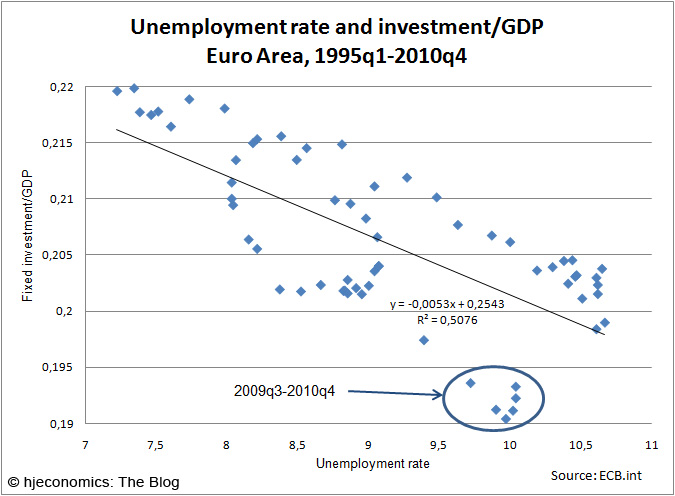
Clearly, one cannot say anything firmly about the causal nature of the relationship. But sometimes simple correlations can give you good ideas. So, I looked at Taylor’s plot for the Euro area. For this economic entity, ECB only has quarterly data back from 1995, and I use all that is available as of today. So please no accusations of “advocacy science”; on the other hand, this is not science, just scatterplots. Note that my choices of x and y-axes are arbitrary; they do not indicate subscription to a particular causal interpretation.
The European scatterplot for unemployment and fixed investment looks like this:
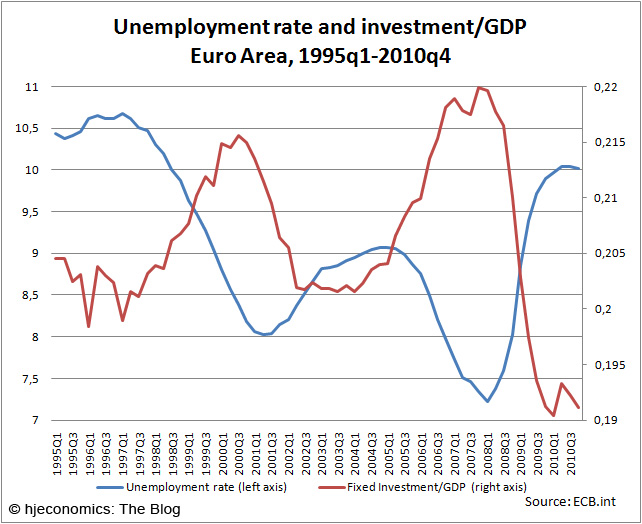
 The negative relation is there, but clearly not as impressive as in the Taylor plot. Other GDP components have little correlation with unemployment, except private consumption which shows a positive correlation (probably reflecting a countercyclical average propensity to consume). A time-series representation of the unemployment/investment rate data looks like this:
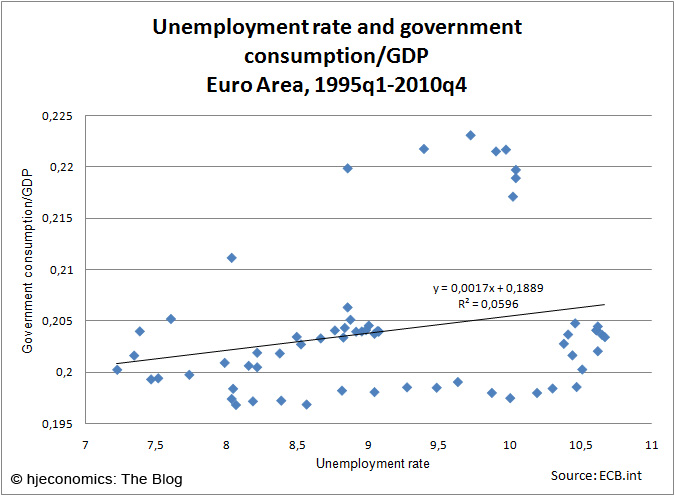
 Now, in terms of the correlation between government spending and unemployment also considered by Taylor, Europe looks not at all similar to the US:
 Unemployment and government spending are positively correlated as in the US, but very weakly so. I guess it will be relatively hard to build a case for unemployment being created by government spending in the European case.
In terms of the current business cycle downturn, there is an interesting difference between the US and Europe’s unemployment and investment experiences as revealed by the Taylor plot. Note that a group of outliers in the European case are the latest six quarters and that these are below the “fitted” line featuring record-low investment and high, but not historically high, unemployment. In contrast, for the US, Krugman shows in yet another post (focusing now only on non-residential investment), that current times are above a fitted line featuring record-high unemployment and investment around its all-time low (this would also be the case when one looks at total investment). He therefore concludes that investment in the US is stronger than you would have expected from past behavior given that unemployment causes investment. On that point, Taylor dryly notes that “unemployment is even higher than the high level that would be expected from the low level of business fixed investment”.
We see again that the devil always does lie in the detail (here, he/she is causality). But seen in the gloomy light of the abysmal US performance, Europe almost seems to be deviating from the norm in a good sense. Despite the worst downturn in decades, Europe is not having record-high unemployment, and the record-low investment ratios are still close to a respectable 20%; not bad compared to the current 12% in the US. Some is good for the European economy after all. Funny though, this will make it difficult to formulate easy-selling policy-platform statements, irrespective of your “causal standpoint”. The Krugman-style economist will stumble when explaining, and facing, the fact that unemployment (even though it is not that high) has created abnormal low investment rates. The Taylor-type economist will find difficulties in promoting tax cuts for businesses when explaining that the low investment rates have created surprisingly low unemployment.
Facts are facts, but scatterplots do not tell a story no matter how impressive they are. And the quick, and wildly diverse, policy recommendations drawn from them, should mainly be put forth in political circles and in media. Not by respected academics.

